Wildfire History
Yulia Zamriy
Historical records of wildfire data.

Image credit: CalFire
Data Sources
There are multiple sources of California wildfire data. The most complete one is maintained by The California Department of Forestry and Fire Protection (CalFire). They provide a database of wildfire perimeters starting from 1878. There are a lot of other gis-format files on their website.
Another useful source is maintained by Geosciences and Environmental Change Science Center. This database has a few advantages over CalFire: it contains wildfire history for the entire US and the perimeters are available by each day of incident (instead of the total area). However, it has significant drawbacks: not all incidents are available and the data is not well organized (the format varies by year).
For our project we used the CalFire database.
CalFire Database
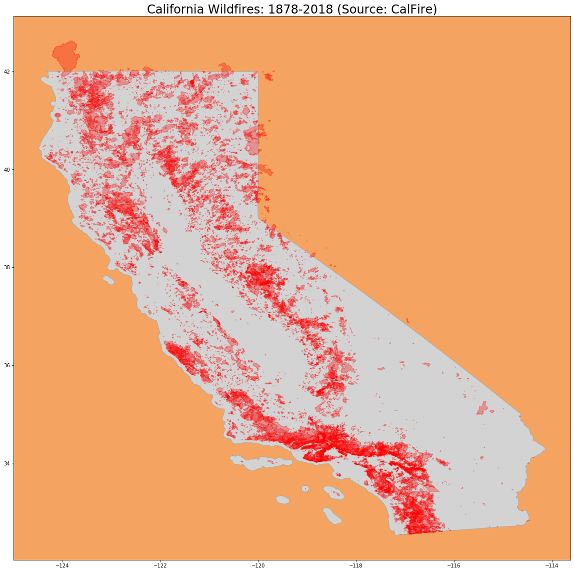
The database available for download contains wildfire perimeters from 1878 to 2018. According to metadata, 2019 data will be added in April 2020.
The database contains information on 20,508 incidents for the available timeframe. As evidenced by the image below, wildfires have not been appearing uniformly across California.
The detailed description of the database is provided here. The complete notebook to process this database is available in the project repo.
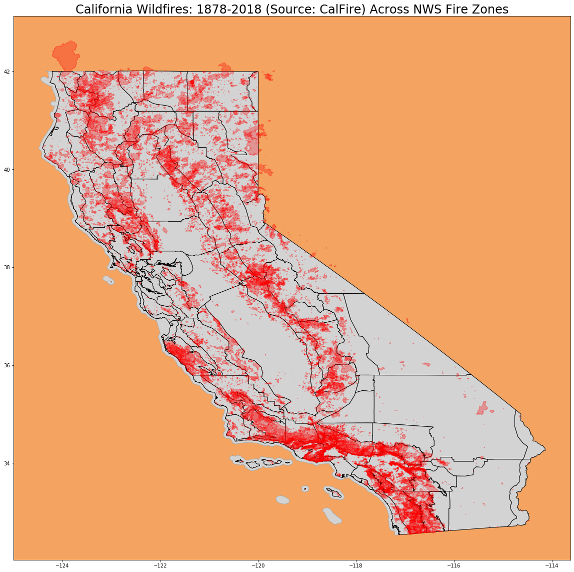
National Weather Service Fire Zones
To investigate the uneven coverage of California by wildfires, we decided to overlay the historical wildfire data with 108 National Weather Service Fire Zones.
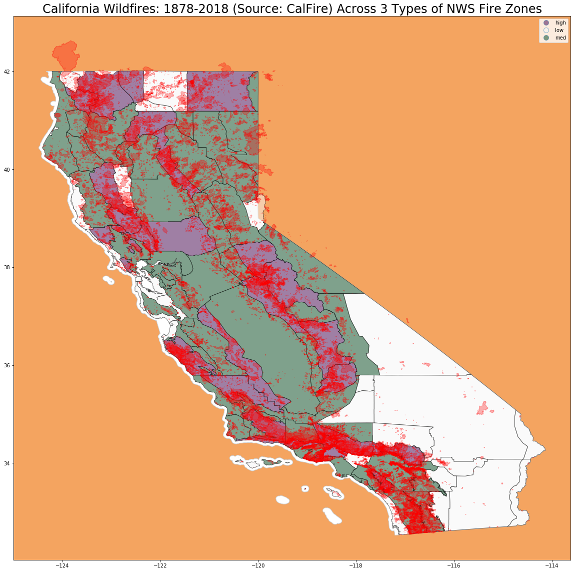
This overlay helped us split California into 3 zones:
- 28 zones with low occurence of wildfires (white)
- 51 zones with medium occurence of wildfires (green)
- 26 zones with high occurence of wildfires (purple)
For the details on how we grouped the zones see this notebook.
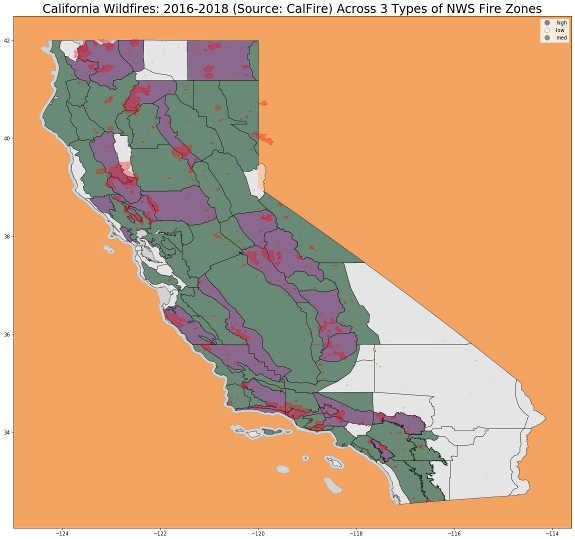
Finally, for our analysis we selected only the last three years of data to help with dataset size (this is discussed in the S2 Cell Geometry post).
Wildfires Frequency and Coverage
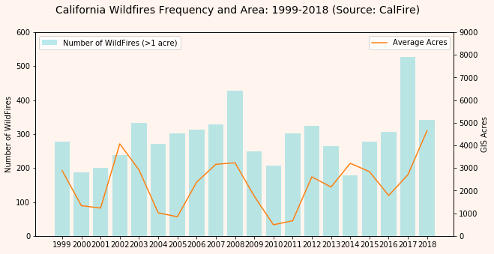
Our initial exploratory data analysis showed that the number and size of wildfires in California varied siginificantly on the annual basis (we focused on the last 20 years). But 2017 stood out for the record number of incidents (607), while 2018 stood out for the unusually high incident average area (4,650 GIS Acres).
Wildfires of 2017 and 2018 stood out also for another rather unfortunate reason: the record number of incidents caused by power lines.
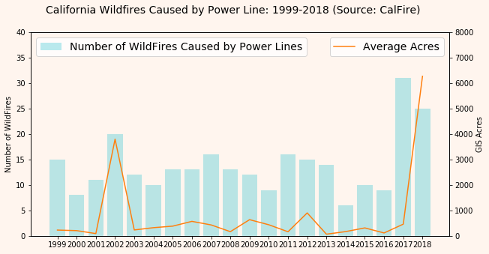
This trend emphasized the importance of investigating the relationship between wildfires and utility infrastructure.
Wildfire Perimeters to S2 Cells
The conversion of wildfire perimeters to S2 Cells is covered in this notebook. But a few key steps in the process were:
- Each incident (row) in the database had a
Polygonobject associated with it containing perimeter coordinates. We extracted these coordinates and converted them into an S2 Loop object. - Since we decided to use
S2 Cellsof 3 different sizes, eachS2 Loopwas converted into 3 types of cells using S2 Region Coverer. - Our final dataset was on the
S2 Cell ID+Datelevel. It was possible that the same cell had multiple wildfires on the same date. Therefore, we aggregated the data to theS2 Cell ID+Datelevel to avoid duplicate keys. - Finally, we merged wildfire history data to our baseline dataset by
S2 Cell ID+Date. As a result, our final dataset contained 3,673 rows with wildfires (out of 11,664,728 total).