Wildfire

Risk Management and Prevention

Using data science techniques to help utility companies predict wildfire risk
and take proactive measures to save lives and property.

Wildfire Risk

Explore current wildfire risk locations
and the factors contributing to risk.


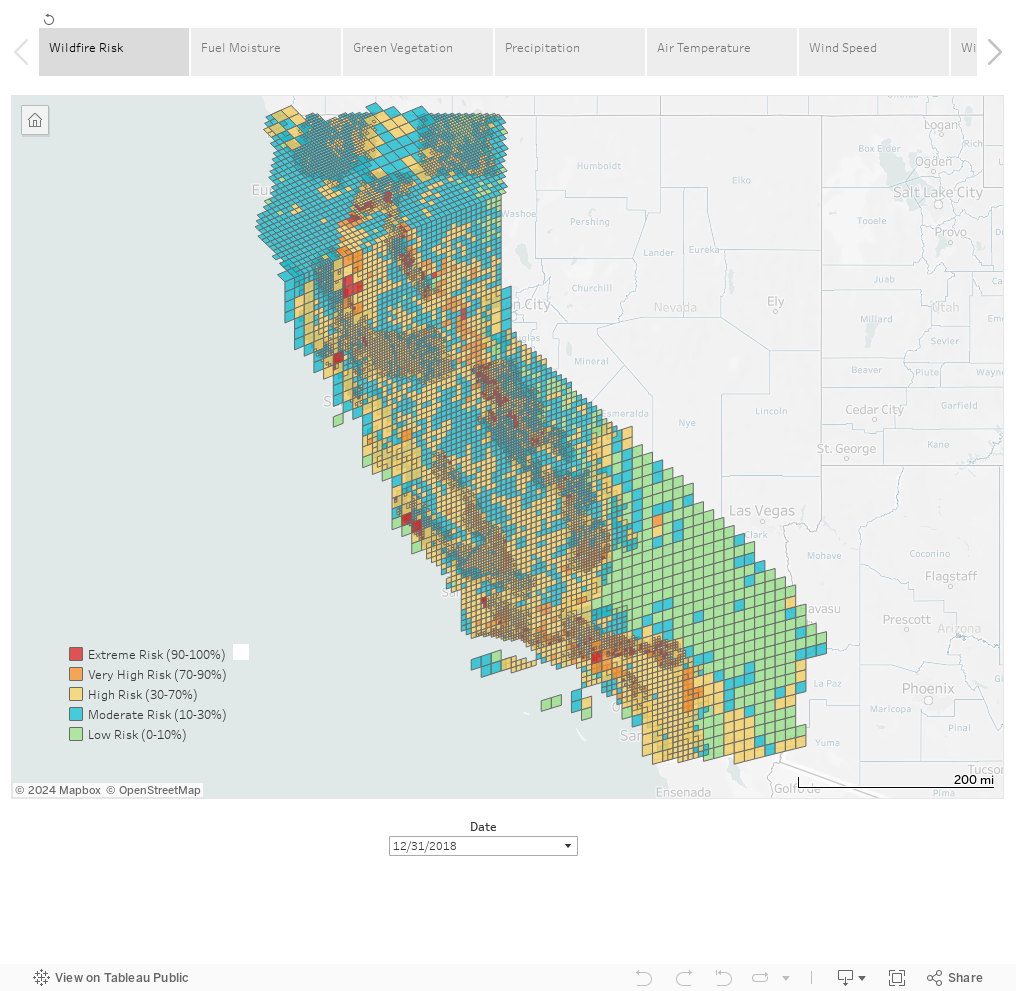
The wildfire risk dashboard displays the estimated risk of wildfire across the state of California. Hovering over the cells creates a tooltip containing the predicted risk estimate and the weather conditions contributing to the wildfire risk. Moving back in time using the date drop down, the dashboard transitions to diplaying historical wildfire data used to train the model. Other tabs in the dashboard display the weather conditions, green vegetation and fuel moisture measurements used in generating the predictions. Use this dashboard to examine current wildfire risk, previous days and years in the same location and then cross reference with localized information on weather and fuel factors contributing to risk.

Transmission Lines

Combine wildfire risk predictions, transmission line and utility data
to make better informed decisions about transmission line risk.


The transmission line dashboard displays the estimated risk of wildfire for locations in California where electrical transmission lines are present. The Transmission Line Owner drop down filters both the map and the Extreme Risk Transmission Lines table to focus on transmission lines owned by a particular utility company. Entering a line ID from the table into the Transmission Line ID drop down displays a particular transmission line of interest and the wildfire risk of the areas the transmission line passes through. By adjusting the date, the change in conditions over time can be taken into consideration.