Transmission Lines
Yulia Zamriy
Transmission Line shapefile conversion.
Image credit: Google search
The California Energy Commission’s GIS data hub provides California energy related geospatial data, including transmission lines. Unlike other data sources, this dataset required minimal processing since it was available in a user-friendly format. A few key steps in the process were:
- Each transmission line (row) in the database had a
Linestringobject associated with it containing coordinates of closely positioned points. We extracted these coordinates and converted them into an S2 PolyLine object. - Since we decided to use
S2 Cellsof 3 different sizes, eachS2 PolyLinewas converted into 3 types of cells using S2 Region Coverer. - It was common for the same cell to contain multiple transmission lines. Also, we used three different cell levels: 9/10/11. To address that, we used a few different aggregation methods to roll up the dataset to the
S2 Cell IDlevel. We counted the number of unique transmission lines per cell. We also looked at the more detailed level 16 S2 Cells that contain transmission lines, then looked at what percent of these more detailed cells existed within the parent S2 Cells. This served as a proxy for the percentage of S2 Cells covered by transmission lines. As a result 4,188 cells contained transmission lines (out of 10,643). - Finally, we merged Transmission Lines data to our baseline dataset by
S2 Cell ID.
The conversion of Transmission Lines Shapefile into S2 Cells is covered in this notebook.
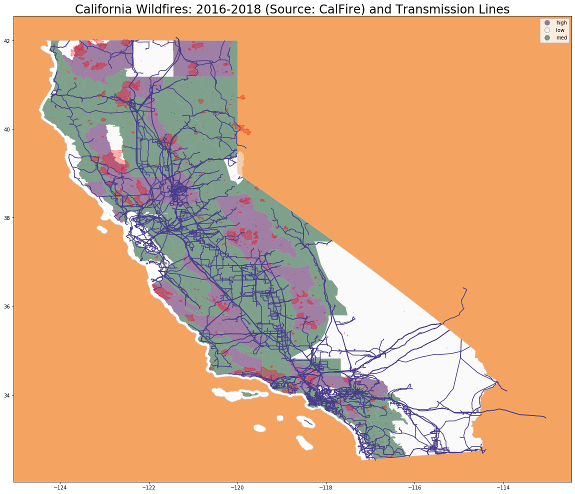
As the image below demonstrates, there is no clear pattern between the location of Transmission Lines and Wildfire incidents. However, our model would help disentangle multiple factors and allocate the fair share of impact to the utility infrastructure.