Capturing the Weather
Cassie Seney
Generating very localized weather measurements for more precise wildfire risk estimates.

Image credit: Tom Barrett
Weather conditions are one of the most important factors in determining wildfire risk. A shift in weather conditions can alleviate the threat of wildfire or escalate the risk. As climate change increases the prevalence of drought and higher temperatures, weather conditions conducive to wildfire have become more common.
Ensuring that we collected all the most relevant weather measurements involved research into publications by the National Weather Service, USDA Forest Service, utility companies and fire investigation reports. In a letter to the California Public Utilities Commission (2018) the utility company Pacific Gas & Electric listed weather conditions they considered before shutting off power to include low humidity levels, sustained high winds and strong wind gusts, and low precipitation. The National Forest Service flags high fire risk based on high temperatures, dry conditions, low humidity and strong winds. CAL FIRE determined the cause of The Camp Fire to be electrical transmission lines in dry vegetation with strong winds, low humidity and warm temperatures. The key weather factors related to wildfire are air temperature, precipitation, relative humidity, wind speed and wind gusts.
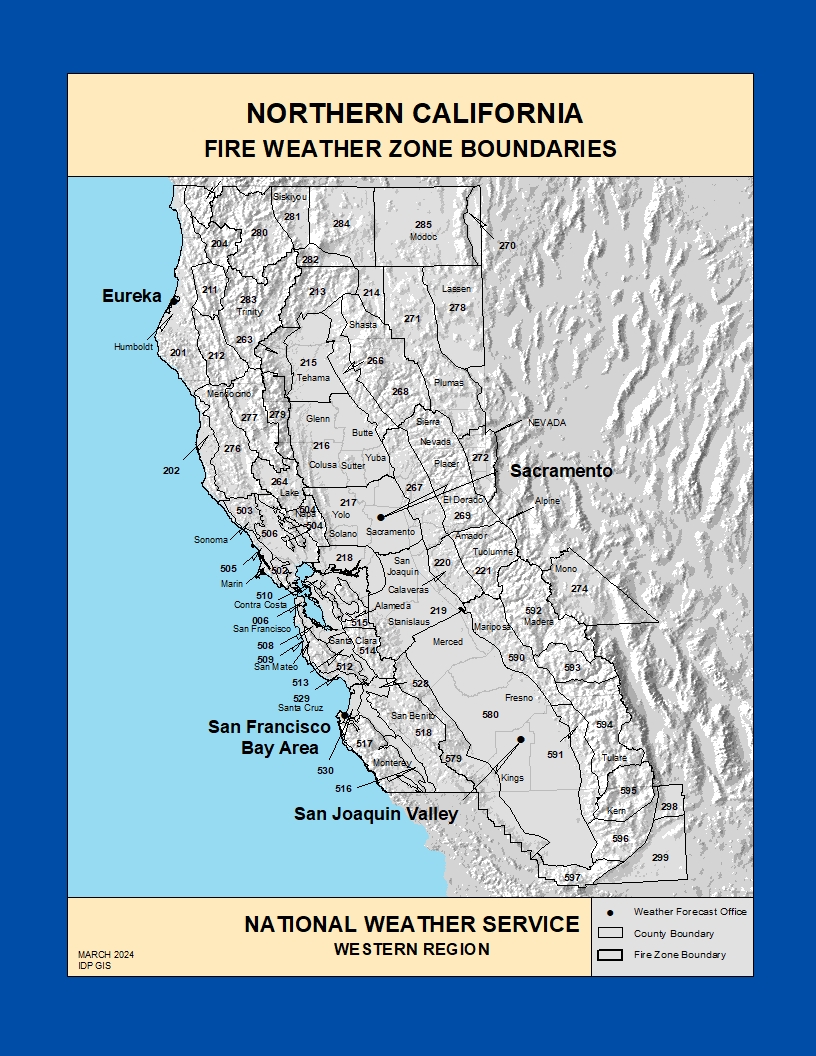
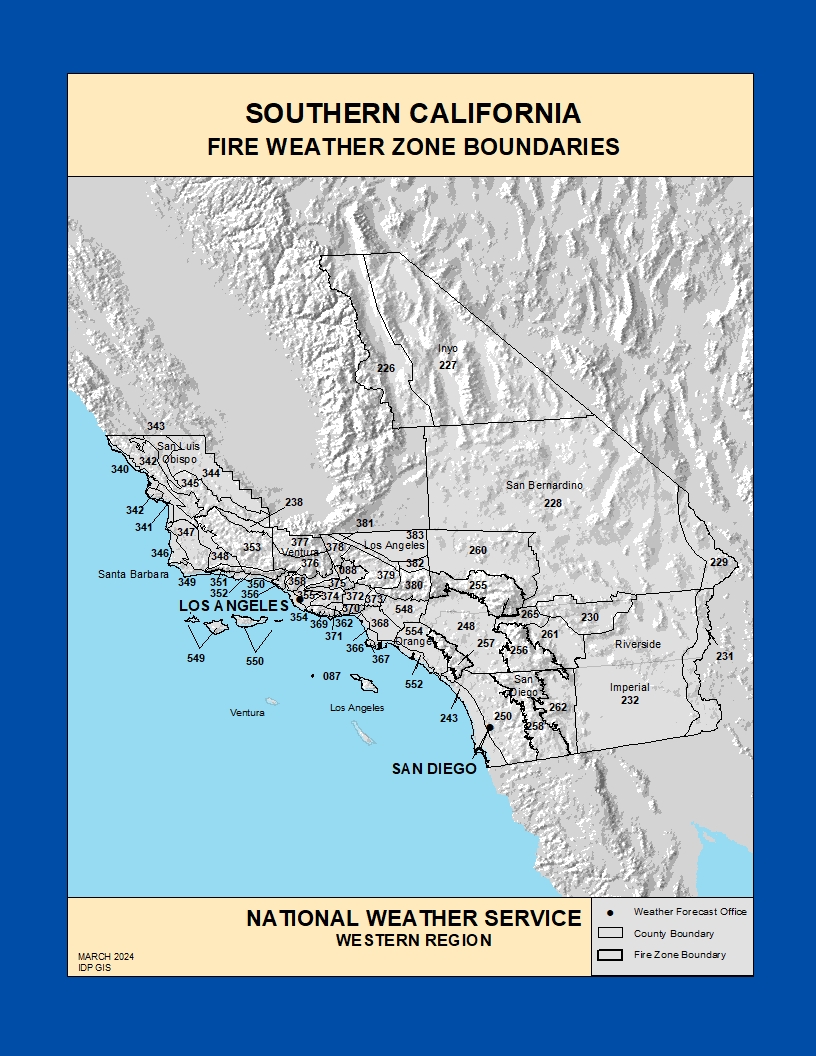
The National Weather Service fire risk zones for northern and southern California cover very broad areas within which there may be variability in weather measurements and actual risk. There are more than 4000 private and public weather stations in California through the National Mesonet Program which aggregates data from all available sources including federally owned, academia, industry and individuals. Leveraging this network enables us to provide more fine grained and specific estimates of fire risk using smaller S2 cell sizes.
Our weather data was obtained from Synoptic Data’s weather station REST API which provides access to 4808 weather stations in California. Within a Python application we used the metadata API to obtain latitude, longitude and station ID, and the timeseries API to obtain observations for 2016-2018 with responses in JSON format. During the data extraction we transformed the JSON into dataframes of observations and calculated features for each station per day: max/min/mean air temperature, max precipitation, max/min/mean relative humidity, max/min/mean wind speed and max wind gust.
There are limits on the number of objects that can be returned by a single API call and also the number of API calls permitted per month. We adjusted our export queries to strike a balance between performance (number of API calls) and resources (memory). We also worked around intermittent service outages (HTTP server internal 500 errors).
Weather stations vary in the frequency with which they collect observations, from every ten minutes to once per day. There is no guarantee that weather stations will provide data every day, so each day the list of stations providing data may vary. Weather stations also vary in the sensors they use to collect data. Although most collect air temperature, not all stations collect precipitation, humidity and wind speed. We accounted for this variability when calculating the S2 cell weather mappings by using the Euclidean distance from the cell centroid to identify the nearest weather station for each type of weather sensor for each day. For instance, a cell may obtain air temperature measurements from one weather station and precipitation from another depending on the sensors available. This allows us to generate the most accurate picture of the weather in any given cell for a particular day.
Extraction, transformation and mapping of weather features to S2 cells resulted in a table of more than 11 million rows of daily S2 cell weather measurements over three years.